Navigating to survey results
There are a number of ways to find survey results in DeviCloud:
- Through the home page dashboard (accessible by clicking the DeviCloud logo), where you can find latest surveys/rig alignment shots, and all sites and projects

- Through the search bar at the top of DeviCloud
- By navigating through site/project/drill program dashboards
Note: It is recommended that surveys are viewed on a 'hole' level, which enables users to select, view and average multiple continuous surveys at once.
- To view a drill hole dashboard, select the hole name


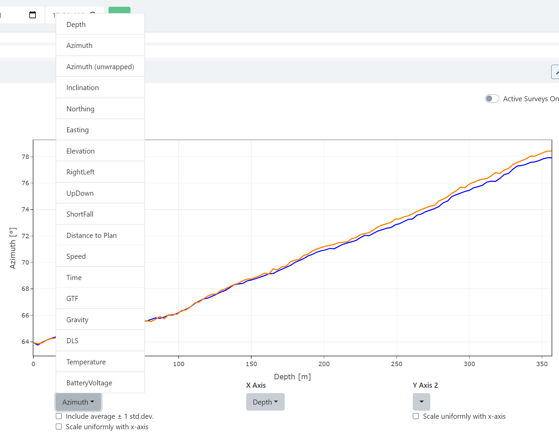
Once surveys are selected, 2D graphs will automatically update in DeviCloud (azimuth graph will display as a default).
To change graph view:
- Click on the Y axis drop-down, followed by the desired graph view. Graph will then update.
To view the QA report in DeviCloud:
- Click view QA report and Graphs. Alternatively, select Download QA report, to download directly as an Excel file.
Reviewing the QA report:
Within the QA report, users can review all information related to drill hole, collar, surveys and movement periods.
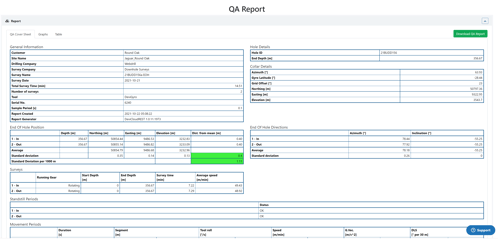
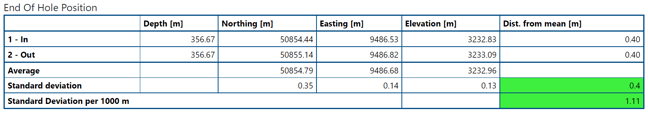
To assess survey quality, the most important value is the standard deviation (misclose). DeviCloud sets the maximum allowed standard deviation of the estimated end of hole position at 5m per 1000m survey depth.
If within this value, the survey will be a green PASS. If not, the survey will flag a red FAIL.
To download QA report, select the option from the drill hole dashboard, within the QA report, or in the Table section of the QA report. This will download as an Excel file and include the QA report, and data from all survey runs including the average run.
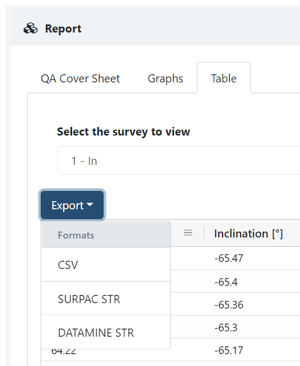
To export CSV or STR formats, navigate to the Table section in the QA report:
- Select Export, followed by the relevant format


To view averaged QA report and survey data:
- Select the number of runs you would like to average by checking their tick box
- Click 'View QA Reports & Graphs'
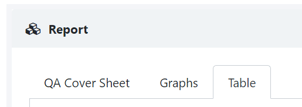
You can now view QA cover sheet, graphs and data points (table) for all combined surveys

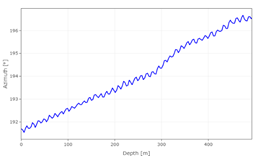
The oscillation filter in DeviCloud is a graphical smoothing function that can be applied to the azimuth and inclination to help:
- Remove the spikes that can be associated with tool rotation, especially during pump-in surveys
- Interpret data where a ‘step’ in Azimuth has occurred in the in or out run. This would most commonly occur at the start of a hole, where a drill pipe may have a slight bend at the collar.
Note: Downhole Surveys recommends that in the instance of a failed survey, DeviGyro operators apply the oscillation filter to check if the survey data can be interpreted as good and ultimately considered a PASS. Doing so however won’t always result in a passed survey and operators should complete other troubleshooting recommendations (review wireline/water control, tool maintenance check, calibration check etc) in the case of continually failing surveys.
 |
|
|
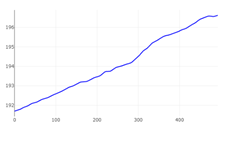
Azimuth plot: No oscillation filter |
Azimuth plot: Oscillation filter applied |
 |
 |
|
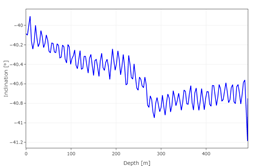
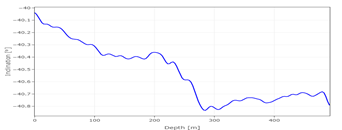
Inclination plot: No oscillation filter |
Inclination plot: Oscillation filter applied |
The filter can be applied in the DeviGyro App following a survey:
- Select Config when viewing survey results, then select Tool Config


- Check if QA results PASS. Survey should be recompleted if still failing.
To apply the filter in DeviCloud:
-
Select the In and Out run to be recalculated, then select Manage Selected Surveys